Heappie! – Heap spray analysis tool.
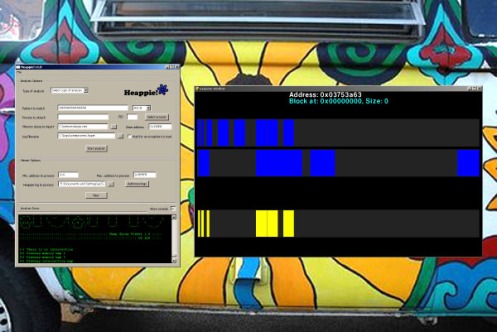
Today, I’m releasing through Core a python tool (with an amazing ultra l337 GUI) that helps the exploit writer to add reliability to its exploits by tracking his heap sprays in a graphical way. Then, this graphics can be analyzed together in order to find heap spray intersections between several runs of different software versions and platforms.
Heappie! counts with 3 main scripts:
– heappie-analyzer.py: Is the script in charge of the process/dump analysis, it finds the patterns in memory and generates a log to be visualized with the viewer:
– heappie-viewer.py: The script that generates the graphics.
– Heappie.py: The front end. It’s just a cheap gui I made to simplify the whole process of running the scripts .
Both scripts (viewer and analyzer) can be used as stand-alone tools so you don’t need to meet all the dependencies if you want to analyze the memory in a platform and visualize it in another.
Heappie! uses two different analysis type:
Attach to a process
When using this type of analysis, Heappie! will attach to a selected process to posteriorly analyze its memory. You can choose to start the analysis immediately or wait an exception to occur. This option is very useful when trying to add reliability to an almost-ready exploit by testing it against different platforms/software versions.
Usually, the heap spray takes place just before triggering the vulnerability so if it is just a POC, the heap spray will occur, the exception will be raised and Heappie! will start the analysis. If the exploit is already working, you can replace the first byte of the shellcode for a \xcc (int 3) to generate a Breakpoint exception to trigger the analysis.
Import memory dump
As I intended to develop Heappie! as a multi platform/architecture tool, I’ve added this option to let you analyze raw memory dumps generated in almost every existent platform/architecture.
The mechanism of Heappie! is extremely simple. It just finds memory patterns and shows as blocks the contiguous data chunks so you don’t need to run Heappie! on the target platform. You can generate the memory dump with any available tool (gdb, for example, supports most of the platforms out there) and then analyze it with Heappie! in another platform.
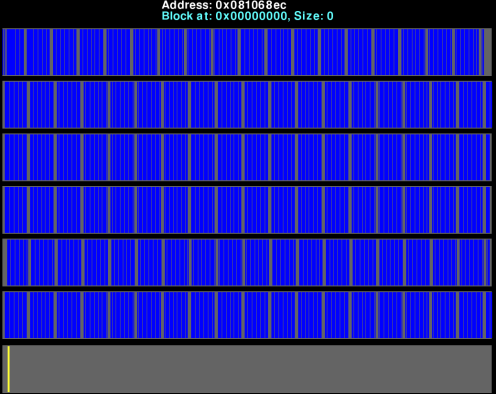
A few screenshots:
– Dependencies
Heappie! relies on two libraries to do most of the work. vtrace (the amazing Kenshoto’s multi-platform debugging library) to analyze the process memory and Pygame to show the logs graphically.
You can found these packages here:
Vtrace
Pythoncard (only if you wanna use the GUI)
I’ve made this tool just to simplify the process of adding reliability to my exploits. As you may note I’m not a developer and my programming skills usually sucks a lot ( That’s why I want to thank Matias Eissler [pinball] and Federico Muttis [acid] for their help ) so please report me the bugs you find, I’ll be glad to fix it.
Also, I suppose that many of you already have your own way (or tool) to locate your heap spray on different scenarios but, in my experience, I’ve found the visual analysis extremely helpful. The tool is regularly used by me and some of my folks here at Core so I thought that it could be useful for you too.
Heappie! can be downloaded from the project’s page here
EDIT: If you’re using Heappie! in windows I invite you to try the version modified by Mario Vilas here. Instead of vtrace, he is using his own library (The awesome WinAppDbg) so in this way, Heappie supports 64 bit 😀


Che, primo renegado de Juan Sacco. Acabo de faltarle el respeto a tu código modificándolo, fijate que te parece y puteá tranquilo que no te voy a dar bola. 😉
Deci que arrancaste tan para la mierda sino te hubiera agradecido y hasta aplaudido porque la verdad es que tengo cero ganas de ponerme a agregarle soporte para 64bits a vtrace. Bueh, no importa, sos groso. Eso, dejando de lado los bueneeesemos tooltips de tu post 😀
Ahora actualizo mi post asi agrego tu version. Abrazo!
Seh, me agarraste en modo troll y te cayo el hacha a vos. 😛
Ademas, yo que culpa tengo de que te confundan con tu pariente (?)
(Tarde o temprano Google va a indexar ese dato las suficientes veces como para que Internet crea que es cierto. Va a ser un trolling epico)
Howdy! I could have sworn I’ve been to this website before but
after ging through a few of the articles I realizd it’s new to me.
Regardless, I’m certainly delighted I stumnled upn it and
I’ll be book-marking iit and checking back frequently!